Getting started with with Reckon Data with dashboards
Because we have downloaded most of reckon data into CreataCRM , for more information what we sync, we can report on this data quick quickly and fast. This aricle is how we can create a Reckon Dashboard inside CreataCRM from Reckon Data
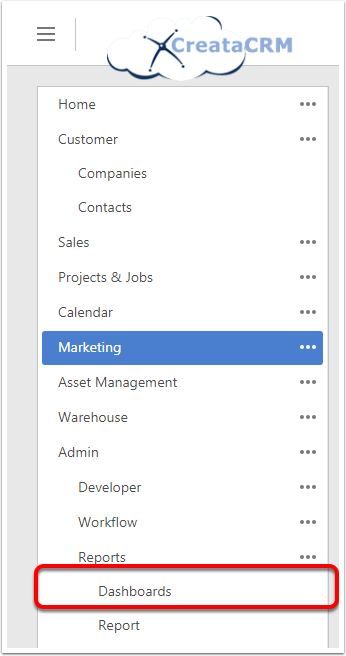
Goto the Dashboard report section
- Navigation Bar
- Admin
- Reports
- Dashboards
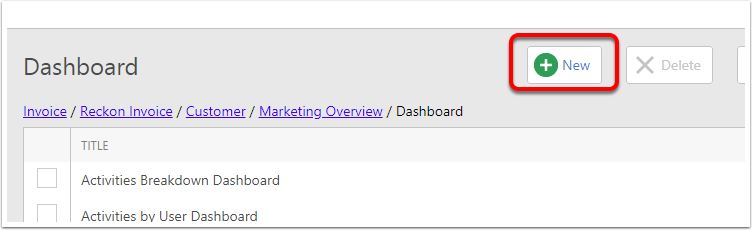
Click on a new Dashboard
Type in the Name of the Report
By Default hte report will be called New Dashboard, We have rename it to the the display name we would like to have this. Which is "Sales Rep from Reckon".
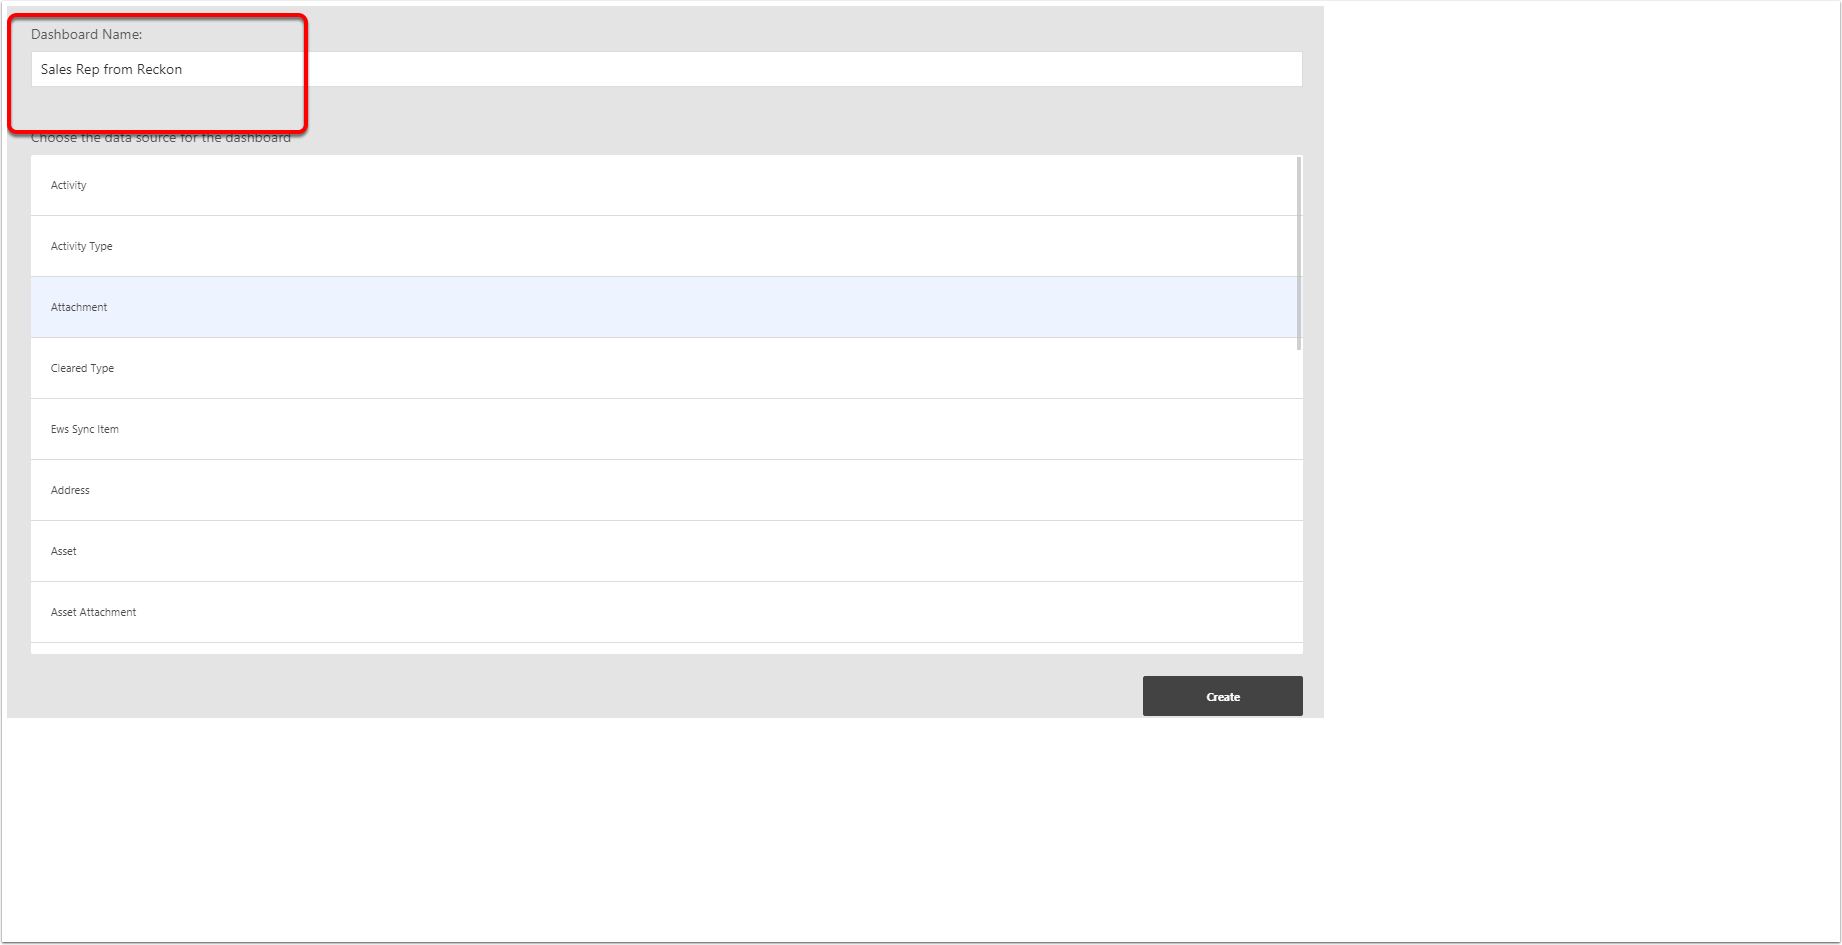
Scroll down and click more until you find your target table, this example, we are looking at Reckon Invoices.
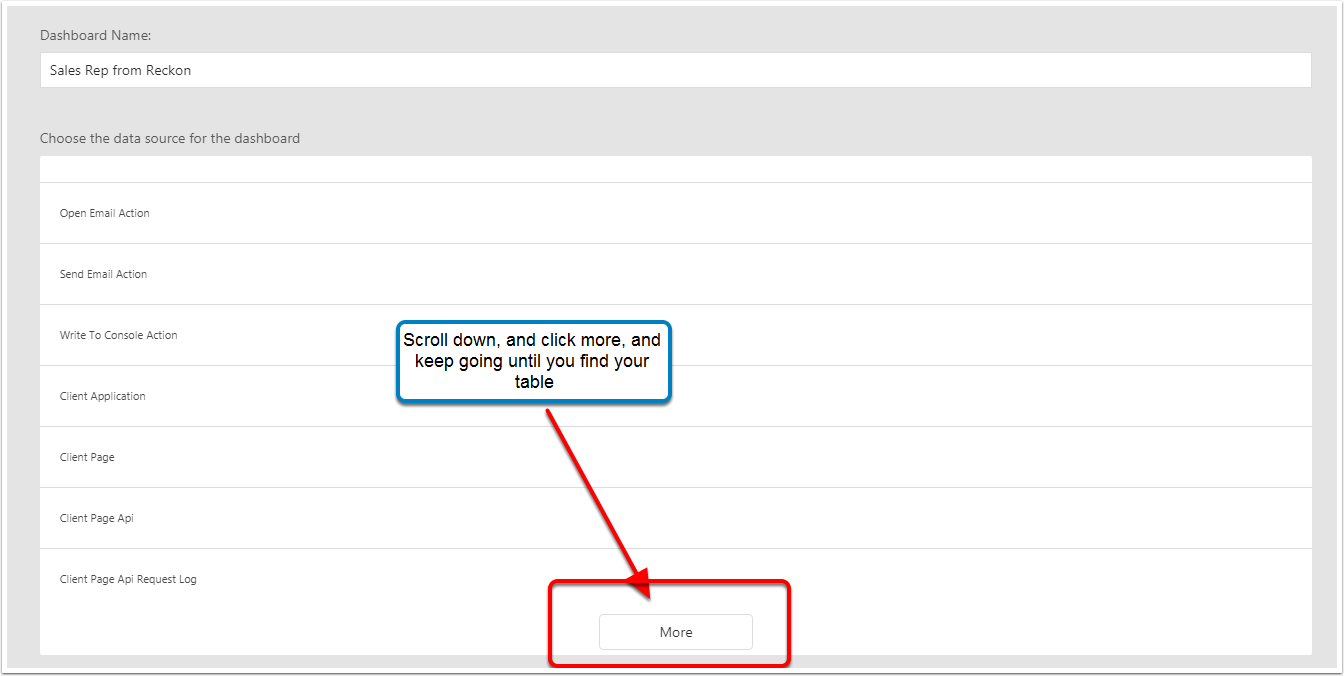
Reckon Inoices
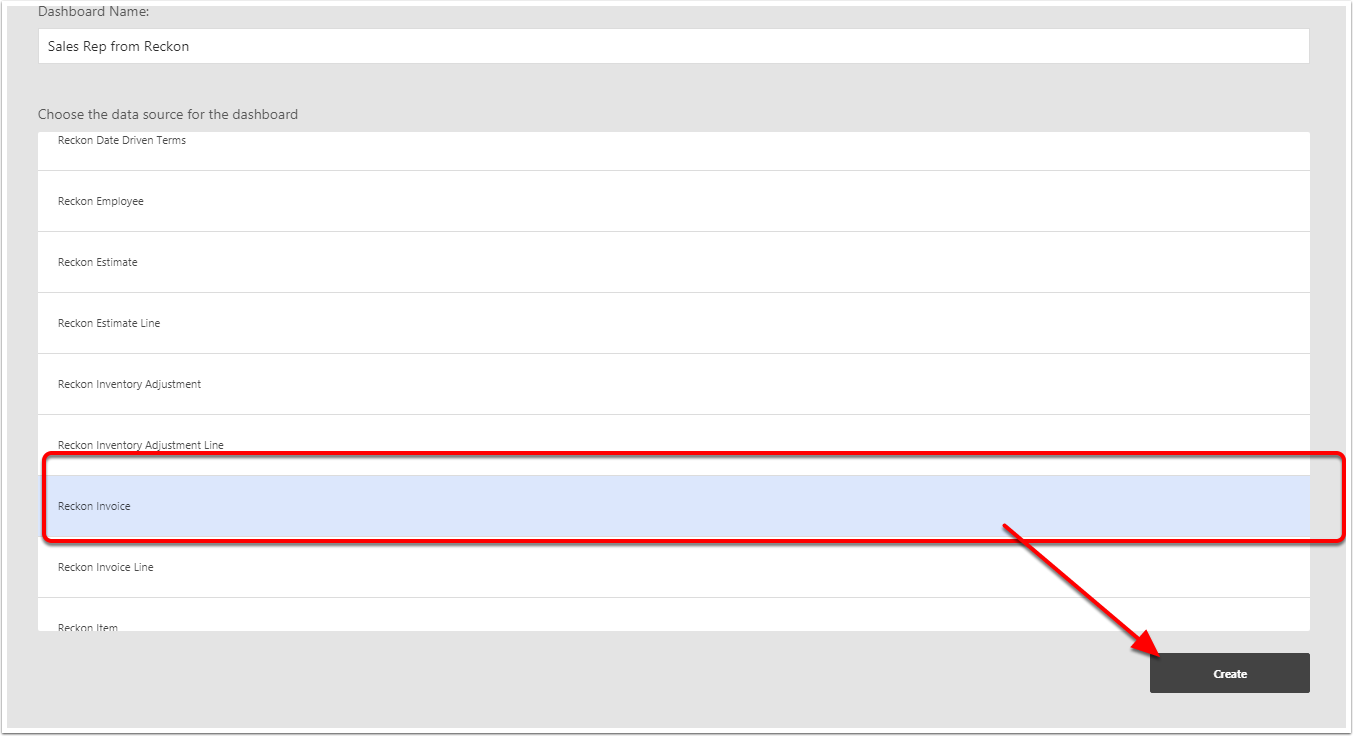
Because reckon is a plugin, the tables are one of the last, so it takes a few scrolls. 10 plus, once you have find your tabe, this one is "Reckon Invoices" select and press create
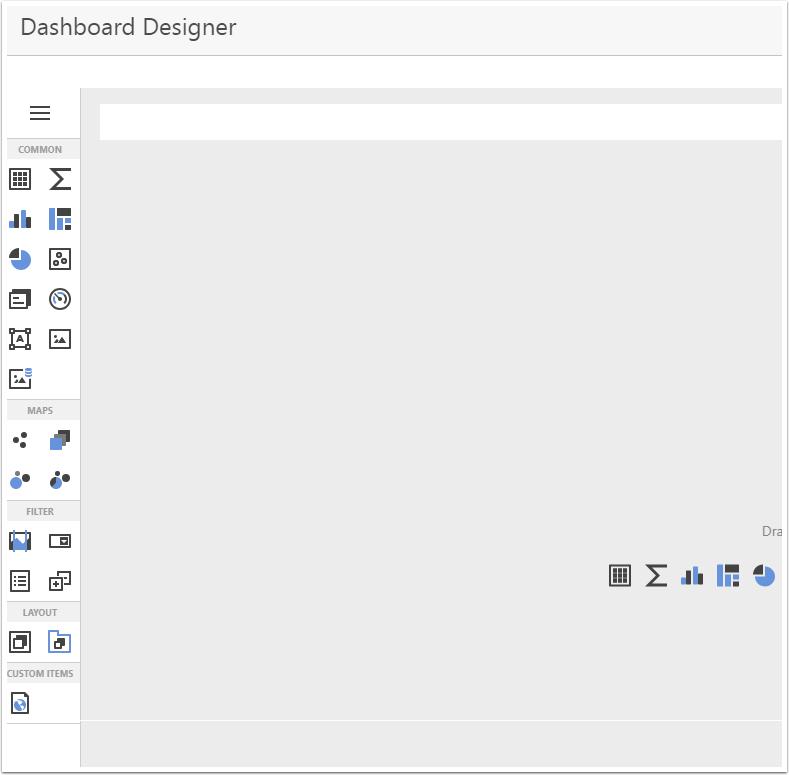
Dashboard Designer
This will open up the dashboard designer, There is many type of dashboard you can design, This link explains a bit more But this article is to get you started.
Dag a common report
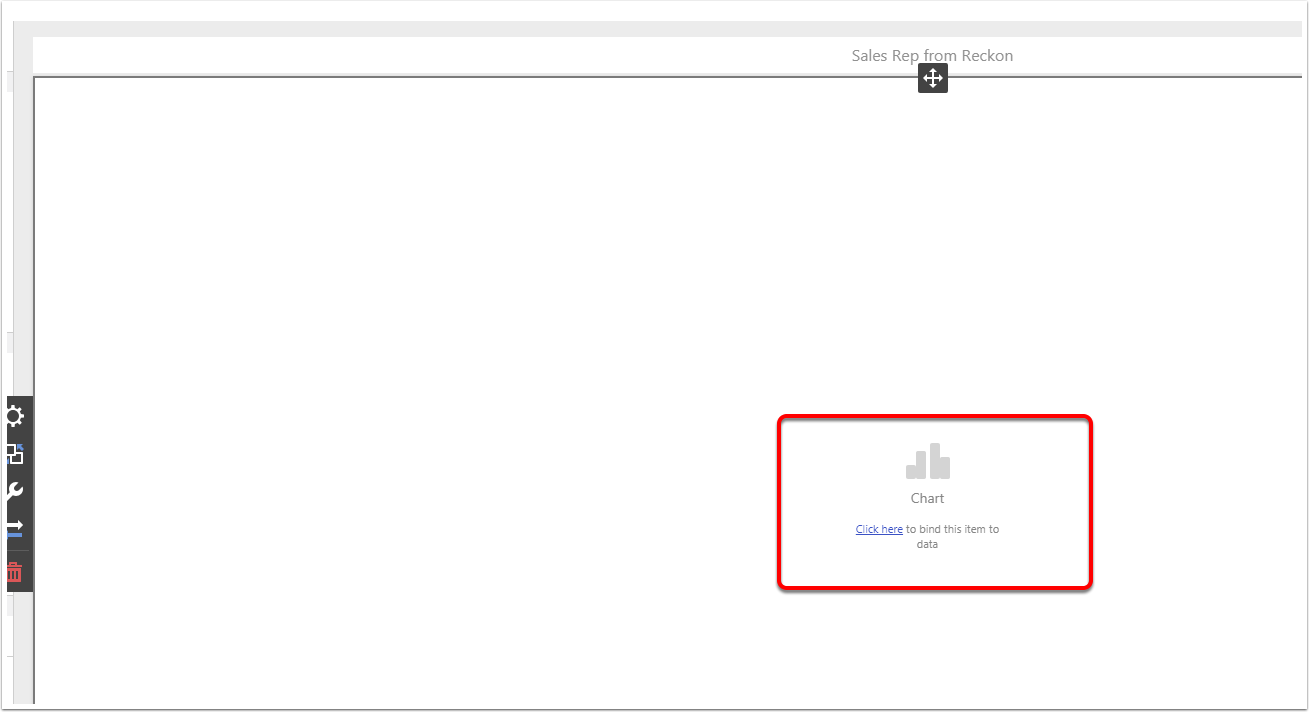
Select the report, and then on your mouse button, and then drag into the workspace. then release your mouse button, we add a chart, for more info about chart click here
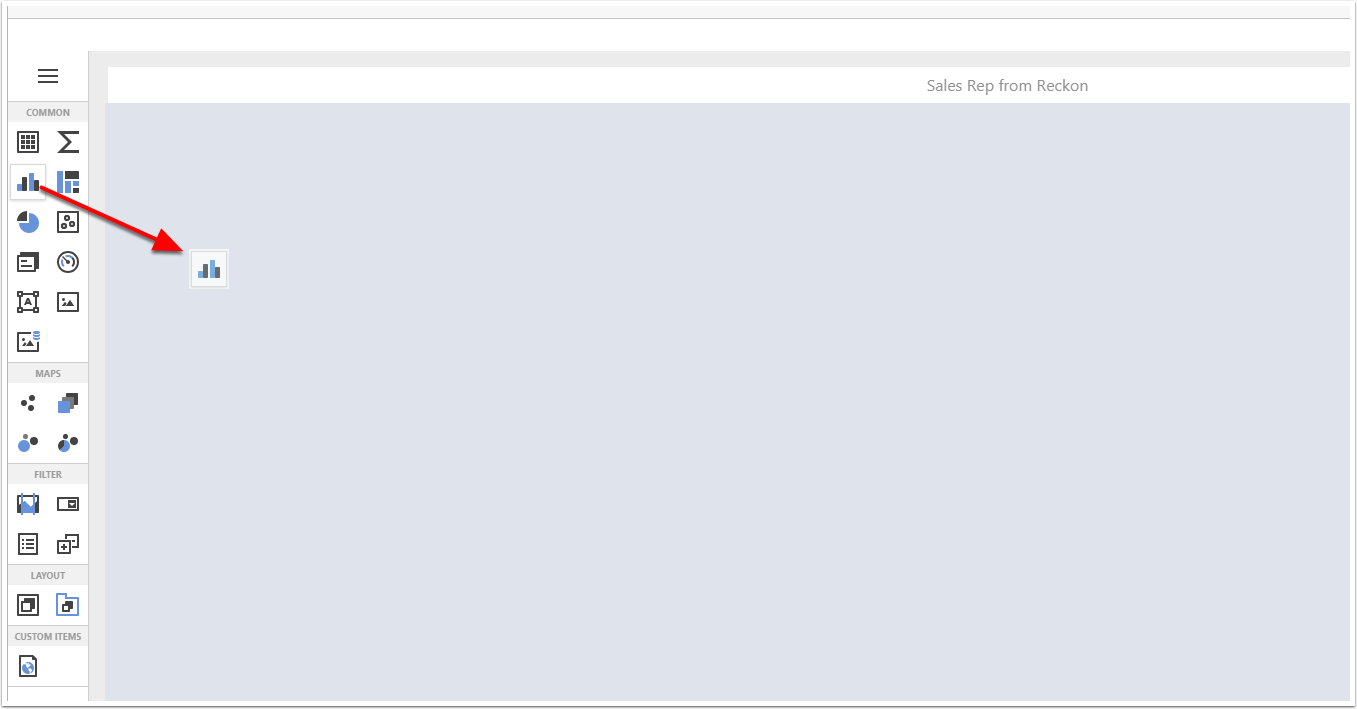
You have your first Dashboard
Click here to start adding the parameters
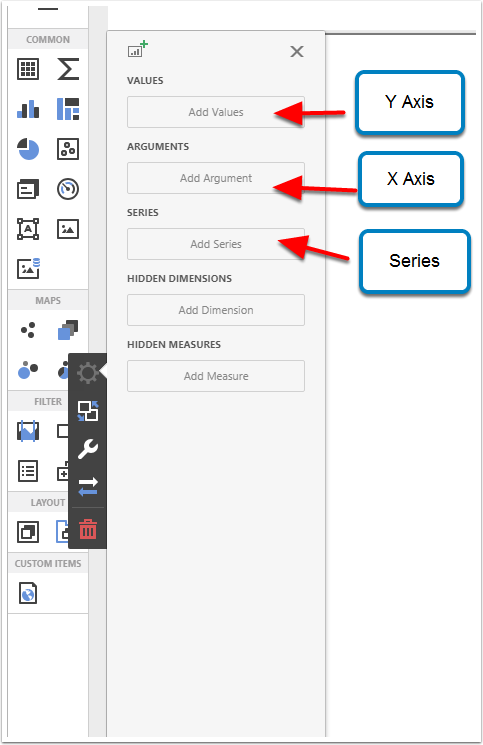
Start adding fields to the dashboard
There is areas we will design
- Values : This is Y axis is the numerical of Values More info
- Aruments This is the X axies is the arguments More info
- Series : For more info
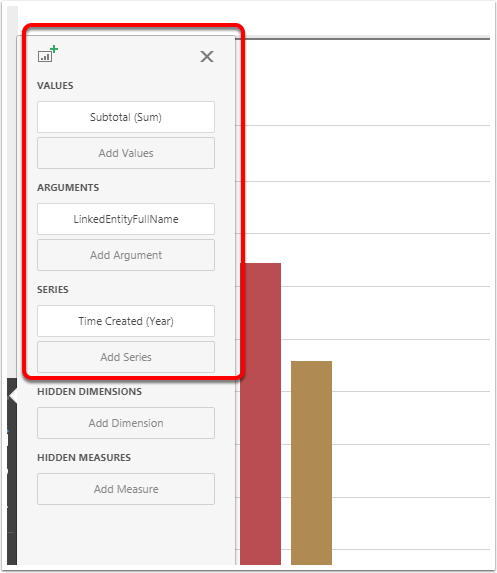
Added below
- Subtotal = Value (Y Axis)
- Sales Rep Name = Argument (X Axis)
- Time Created = Series Which is a series of Dates group by Year for this example
To Configure Filter Range for Series
Drag and drop the filter range icon in hte Fiilter section, place it underneath the first section
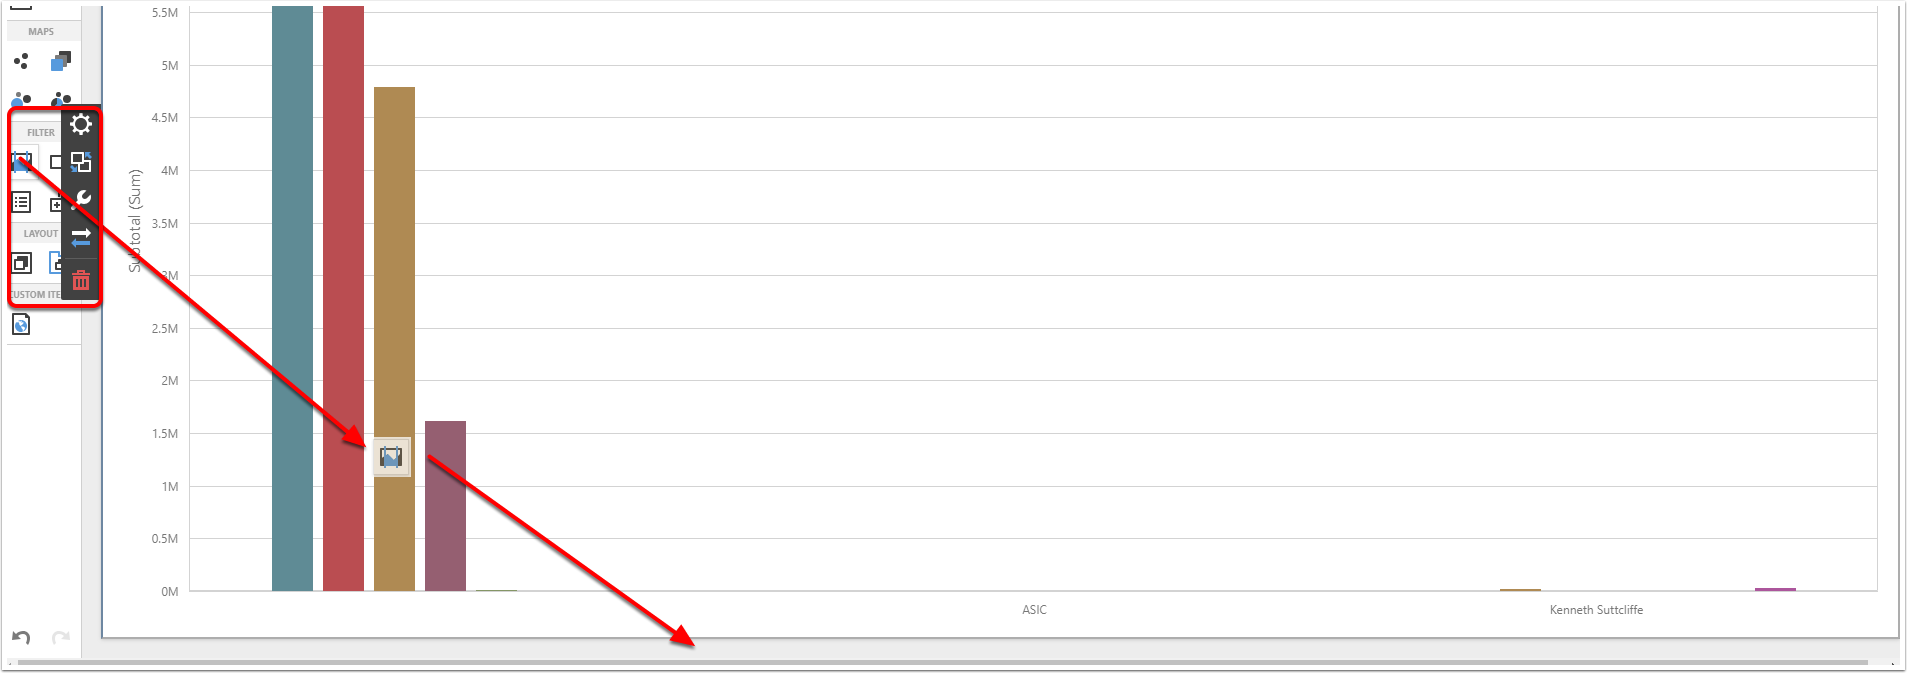
It will display a Range filter below
Then add the X and Y axis
- Subtotal = Value (Y Axis)
- Time Created Name = Argument (X Axis)
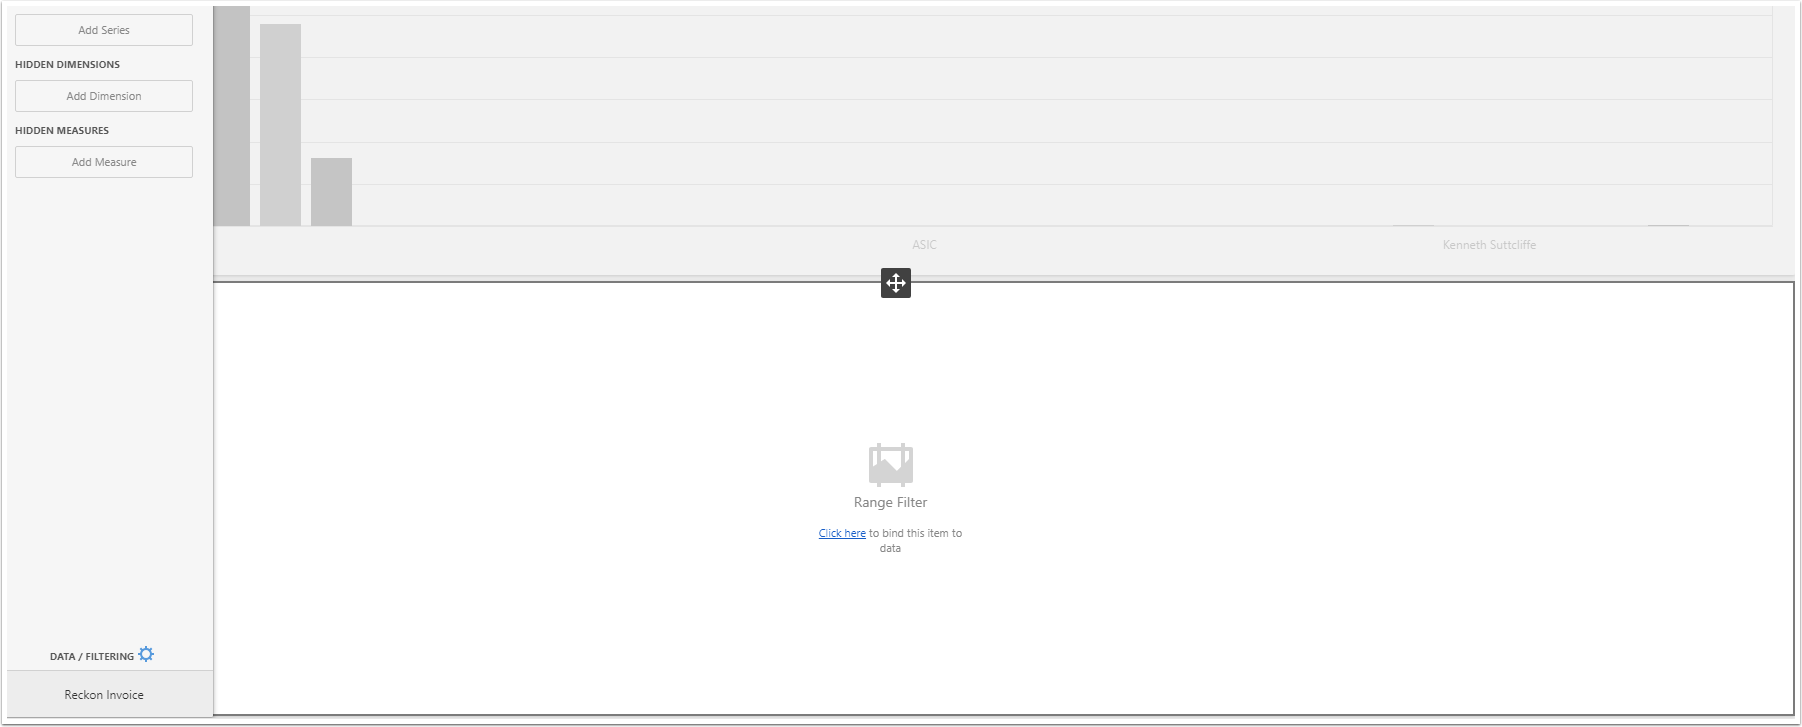
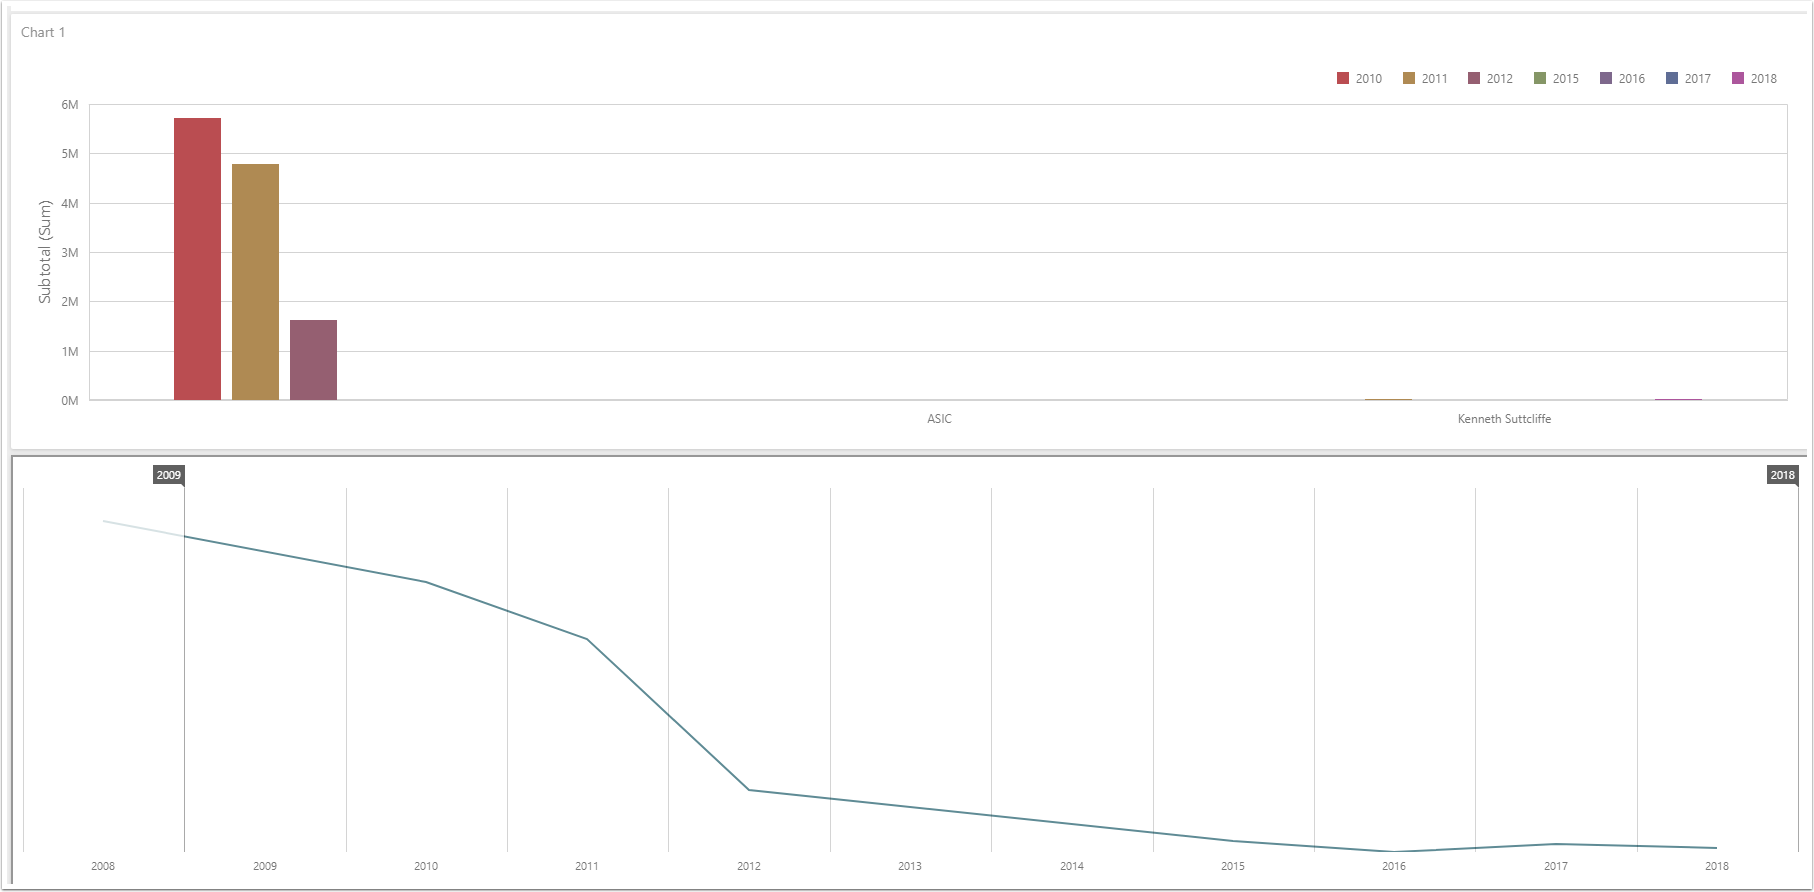
This will now display a Sliding Date range
You now have a interactive Dashboard and you can change the date range which will change the displayed charts
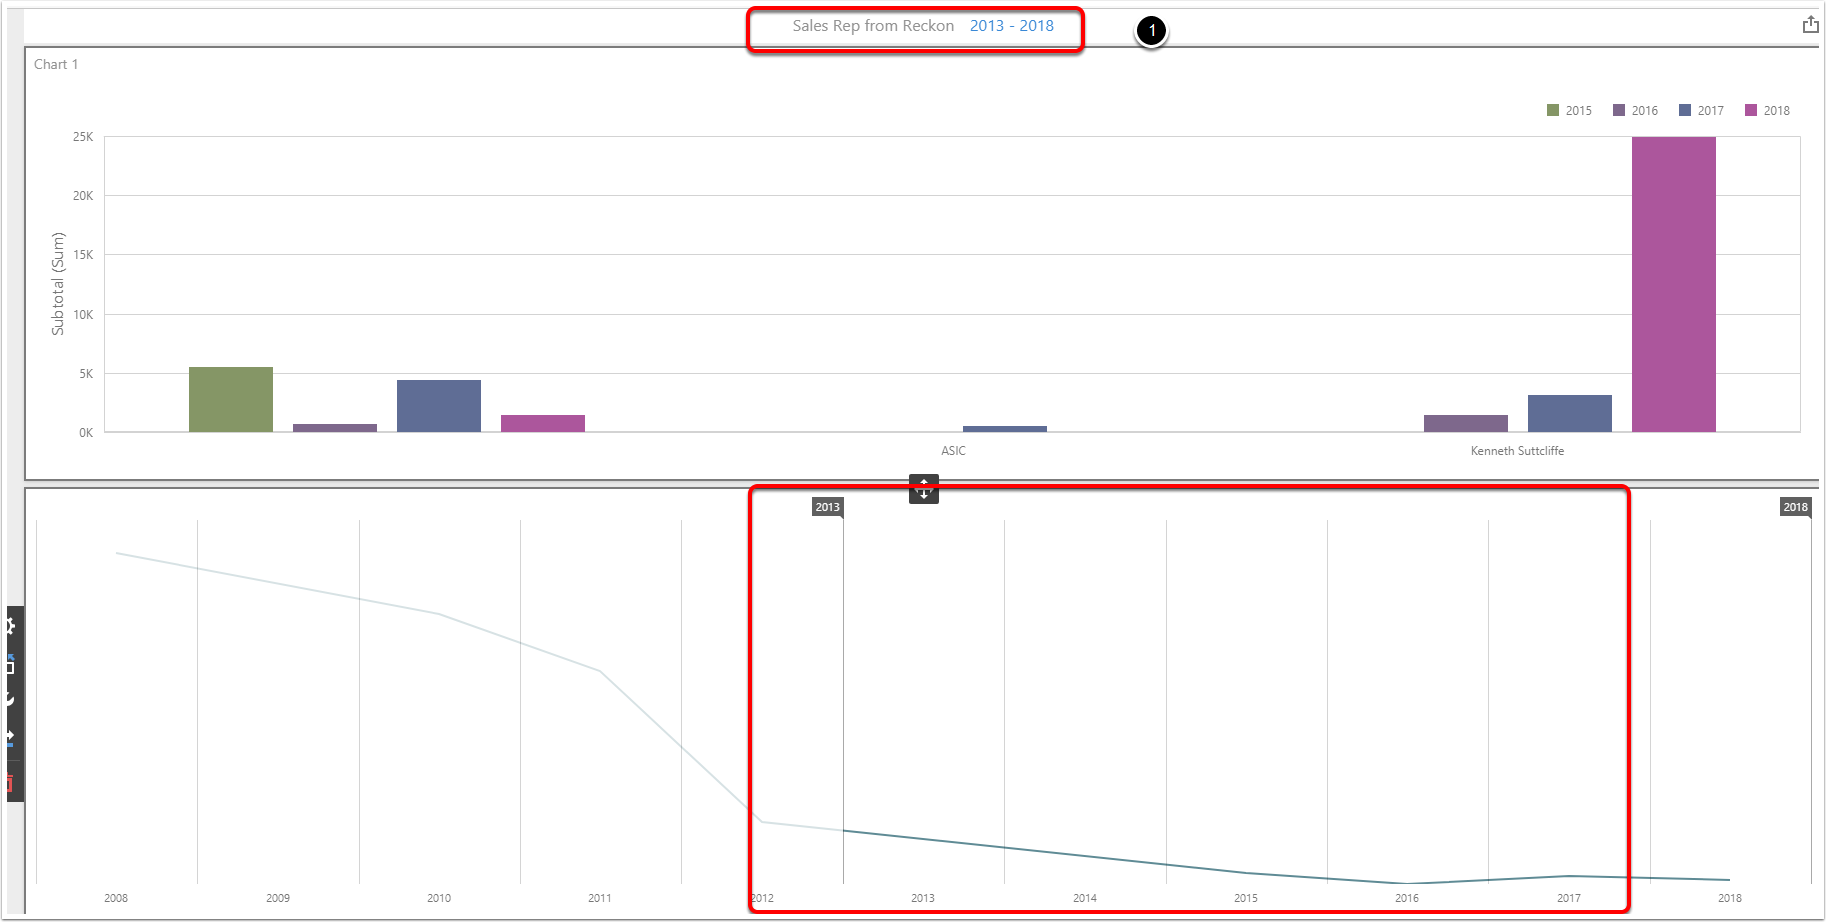
Change the Dates
This example changed this to 2013 to 2018
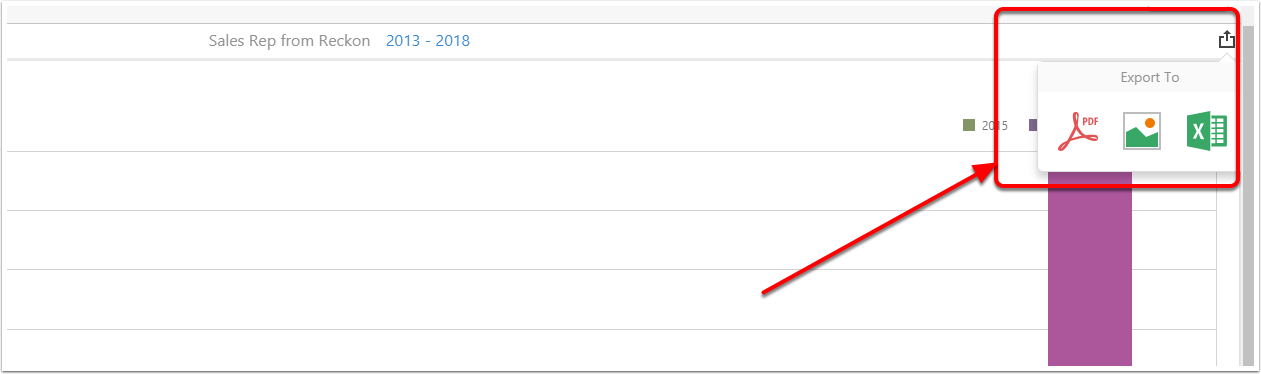
Yo can export these dashboards
In the top right you can export them
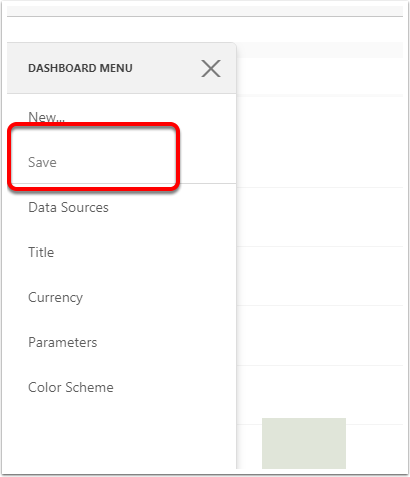
Click on save
Click on the top right Navigation buttoon and click Save, then clck close